Saving & Training Multiple Models
Subscribe to Tech with Tim
In this tutorial we will be creating multiple models and saving ones that generate the best scores. We will also be plotting our data points to see a graphical representation of data correlation.
Installing Packages
In this tutorial we will need to install one more module called matplotlib. We will also be using the module pickle that does not need to be installed.
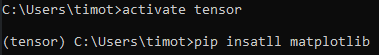
Similarly to before we will activate our environment using activate "environment name" and then type pip install matplotlib in the command prompt.
Importing Modules
We need to import pickle and matplotlib as well as all of the previous modules before starting.
#Import Libraries
import numpy as np
import pandas as pd
from sklearn import linear_model
import sklearn
from sklearn.utils import shuffle
import matplotlib.pyplot as plt
from matplotlib import style
import pickle
Saving Our Model
To save our model we will write to a new file using pickle.dump().
with open("studentgrades.pickle", "wb") as f:
    pickle.dump(linear, f)

# linear is the name of the model we created in the last tutorial
# it should be defined above this
Loading Our Model
Once we've saved our model we can load it in using the following two lines. Now you can remove the code that creates and trains our model as we are simply loading in an existing one from our pickle file.
pickle_in = open("studentgrades.pickle", "rb")
linear = pickle.load(pickle_in)

# Now we can use linear to predict grades like before
Training Multiple Models
You may have noticed that our models vary in accuracy. This is because when we split the data into training and testing data it is divided differently each time. Since our model trains very quickly it may be worth training multiple models and saving the best one. We can do this in the following way.
# TRAIN MODEL MULTIPLE TIMES FOR BEST SCORE
best = 0
for _ in range(20):
    x_train, x_test, y_train, y_test = sklearn.model_selection.train_test_split(x, y, test_size=0.1)

    linear = linear_model.LinearRegression()

    linear.fit(x_train, y_train)
    acc = linear.score(x_test, y_test)
    print("Accuracy: " + str(acc))

    # If the current model has a better score than one we've already trained then save it
    if acc > best:
        best = acc
        with open("studentgrades.pickle", "wb") as f:
            pickle.dump(linear, f)
Plotting Our Data
To get a visual representation of our data we can plot it using the matplotlib library we installed earlier. We are going to use a scatter plot to visualize our data.
# Drawing and plotting model
plot = "failures" # Change this to G1, G2, studytime or absences to see other graphs
plt.scatter(data[plot], data["G3"])
plt.legend(loc=4)
plt.xlabel(plot)
plt.ylabel("Final Grade")
plt.show()
Full Code
#Import Library
import numpy as np
import pandas as pd
from sklearn import linear_model
import sklearn
from sklearn.utils import shuffle
import matplotlib.pyplot as plt
from matplotlib import style
import pickle

style.use("ggplot")

data = pd.read_csv("student-mat.csv", sep=";")

predict = "G3"

data = data[["G1", "G2", "absences","failures", "studytime","G3"]]
data = shuffle(data) # Optional - shuffle the data

x = np.array(data.drop([predict], 1))
y =np.array(data[predict])
x_train, x_test, y_train, y_test = sklearn.model_selection.train_test_split(x, y, test_size=0.1)


# TRAIN MODEL MULTIPLE TIMES FOR BEST SCORE
best = 0
for _ in range(20):
    x_train, x_test, y_train, y_test = sklearn.model_selection.train_test_split(x, y, test_size=0.1)

    linear = linear_model.LinearRegression()

    linear.fit(x_train, y_train)
    acc = linear.score(x_test, y_test)
    print("Accuracy: " + str(acc))

    if acc > best:
        best = acc
        with open("studentgrades.pickle", "wb") as f:
            pickle.dump(linear, f)

# LOAD MODEL
pickle_in = open("studentgrades.pickle", "rb")
linear = pickle.load(pickle_in)


print("-------------------------")
print('Coefficient: \n', linear.coef_)
print('Intercept: \n', linear.intercept_)
print("-------------------------")

predicted= linear.predict(x_test)
for x in range(len(predicted)):
    print(predicted[x], x_test[x], y_test[x])


# Drawing and plotting model
plot = "failures"
plt.scatter(data[plot], data["G3"])
plt.legend(loc=4)
plt.xlabel(plot)
plt.ylabel("Final Grade")
plt.show()