Linear Regression P.2
Subscribe to Tech with Tim
This tutorial will be dedicated to understanding how the linear regression algorithm works and implementing it to make predictions using our data set. For a very detailed explanation of how this algorithm works please watch the video.
How Does it Work?
Linear Regression is essentially just a best fit line. Given a set of data the algorithm will create a best fit line through those data points.
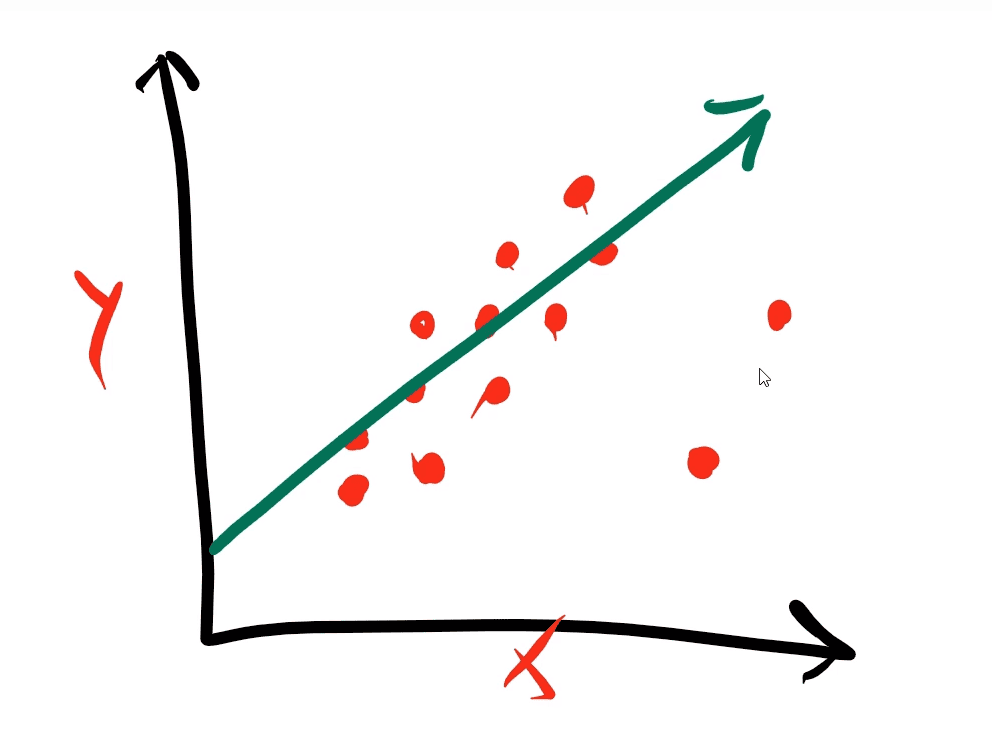
This line can be defined by the equation y = m*x + b.
m is the slope. Meaning how much the y value increases for each x value.
b is the y intercept. Where the line crosses the y axis.
We can determine the slope(m) of the line by picking two points on the line (p1 and p2) and using the following equation: m = (y2 - y1) / (x2 - x1) linear regression python
Once the computer has generated this line it will use it to predict certain values.
Note: The examples above are done in 2D space. In reality most of our best fit lines will span across multiple dimensions and therefore will have multiple slope values.
Implementing the Algorithm
Now that we understand how linear regression works we can use it to predict students final grades.
We will start by defining the model which we will be using.
linear = linear_model.LinearRegression()
Next we will train and score our model using the arrays we created in the previous tutorial.
linear.fit(x_train, y_train)
acc = linear.score(x_test, y_test) # acc stands for accuracy
To see how well our algorithm performed on our test data we can print out the accuracy.
print(acc)
For this specific data set a score of above 80% is fairly good.
Viewing The Constants
If we want to see the constants used to generate the line we can type the following.
print('Coefficient: \n', linear.coef_) # These are each slope value
print('Intercept: \n', linear.intercept_) # This is the intercept
Predicting on Specific Students
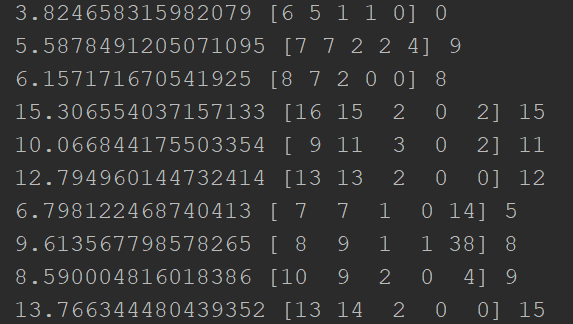
Seeing a score value is cool but I'd like to see how well our algorithm works on specific students. To do this we are going to print out all of our test data. Beside this data we will print the actual final grade and our models predicted grade.
predictions = linear.predict(x_test) # Gets a list of all predictions

for x in range(len(predictions)):
    print(predictions[x], x_test[x], y_test[x])
Our output should look something like this.
Full Code
import pandas as pd
import numpy as np
import sklearn
from sklearn import linear_model
from sklearn.utils import shuffle

data = pd.read_csv("student-mat.csv", sep=";")

data = data[["G1", "G2", "G3", "studytime", "failures", "absences"]]

predict = "G3"

X = np.array(data.drop([predict], 1))
y = np.array(data[predict])

x_train, x_test, y_train, y_test = sklearn.model_selection.train_test_split(X, y, test_size = 0.1)

linear = linear_model.LinearRegression()

linear.fit(x_train, y_train)
acc = linear.score(x_test, y_test)
print(acc)

print('Coefficient: \n', linear.coef_)
print('Intercept: \n', linear.intercept_)

predictions = linear.predict(x_test)

for x in range(len(predictions)):
    print(predictions[x], x_test[x], y_test[x])