K Means Clustering P.2 – Implementing K Means
Subscribe to Tech with Tim
Implementing K Means Clustering
For this tutorial we will implement the K Means algorithm to classify hand written digits. Like the last tutorial we will simply import the digits data set from sklean to save us a bit of time.
Importing Modules
Before we can begin we must import the following modules.
import numpy as np
import sklearn
from sklearn.preprocessing import scale
from sklearn.datasets import load_digits
from sklearn.cluster import KMeans
from sklearn import metrics
Loading the Data-set
We are going to load the data set from the sklean module and use the scale function to scale our data down. We want to convert the large values that are contained as features into a range between -1 and 1 to simplify calculations and make training easier and more accurate.
digits = load_digits()
data = scale(digits.data)
y = digits.target

k = 10
samples, features = data.shape
We also define the amount of clusters by creating a variable k and we define how many samples and features we have by getting the data set shape.
Scoring
To score our model we are going to use a function from the sklearn website. It computes many different scores for different parts of our model. If you’d like to learn more about what these values mean please visit the following website.
def bench_k_means(estimator, name, data):
    estimator.fit(data)
    print('%-9s\t%i\t%.3f\t%.3f\t%.3f\t%.3f\t%.3f\t%.3f'
          % (name, estimator.inertia_,
             metrics.homogeneity_score(y, estimator.labels_),
             metrics.completeness_score(y, estimator.labels_),
             metrics.v_measure_score(y, estimator.labels_),
             metrics.adjusted_rand_score(y, estimator.labels_),
             metrics.adjusted_mutual_info_score(y,  estimator.labels_),
             metrics.silhouette_score(data, estimator.labels_,
                                      metric='euclidean')))
Training the Model
Finally to train the model we will create a K Means classifier then pass that classifier to the function we created above to score and train it.
clf = KMeans(n_clusters=k, init="random", n_init=10)
bench_k_means(clf, "1", data)
MatplotLib Visualization Example
To see a visual representation of how K Means works you can copy and run this code from your computer. It is from the SkLearn documentation. It looks something like this:
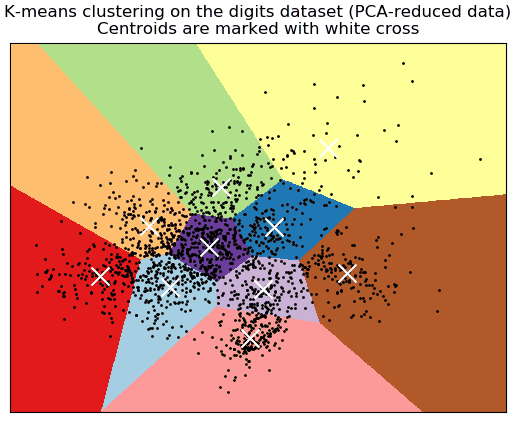
from time import time
import numpy as np
import matplotlib.pyplot as plt

from sklearn import metrics
from sklearn.cluster import KMeans
from sklearn.datasets import load_digits
from sklearn.decomposition import PCA
from sklearn.preprocessing import scale

np.random.seed(42)

digits = load_digits()
data = scale(digits.data)

n_samples, n_features = data.shape
n_digits = len(np.unique(digits.target))
labels = digits.target

sample_size = 300

print("n_digits: %d, \t n_samples %d, \t n_features %d"
      % (n_digits, n_samples, n_features))


print(82 * '_')
print('init\t\ttime\tinertia\thomo\tcompl\tv-meas\tARI\tAMI\tsilhouette')


def bench_k_means(estimator, name, data):
    t0 = time()
    estimator.fit(data)
    print('%-9s\t%.2fs\t%i\t%.3f\t%.3f\t%.3f\t%.3f\t%.3f\t%.3f'
          % (name, (time() - t0), estimator.inertia_,
             metrics.homogeneity_score(labels, estimator.labels_),
             metrics.completeness_score(labels, estimator.labels_),
             metrics.v_measure_score(labels, estimator.labels_),
             metrics.adjusted_rand_score(labels, estimator.labels_),
             metrics.adjusted_mutual_info_score(labels,  estimator.labels_),
             metrics.silhouette_score(data, estimator.labels_,
                                      metric='euclidean',
                                      sample_size=sample_size)))

bench_k_means(KMeans(init='k-means++', n_clusters=n_digits, n_init=10),
              name="k-means++", data=data)

bench_k_means(KMeans(init='random', n_clusters=n_digits, n_init=10),
              name="random", data=data)


print(82 * '_')

# #############################################################################
# Visualize the results on PCA-reduced data

reduced_data = PCA(n_components=2).fit_transform(data)
kmeans = KMeans(init='k-means++', n_clusters=n_digits, n_init=10)
kmeans.fit(reduced_data)

# Step size of the mesh. Decrease to increase the quality of the VQ.
h = .02     # point in the mesh [x_min, x_max]x[y_min, y_max].

# Plot the decision boundary. For that, we will assign a color to each
x_min, x_max = reduced_data[:, 0].min() - 1, reduced_data[:, 0].max() + 1
y_min, y_max = reduced_data[:, 1].min() - 1, reduced_data[:, 1].max() + 1
xx, yy = np.meshgrid(np.arange(x_min, x_max, h), np.arange(y_min, y_max, h))

# Obtain labels for each point in mesh. Use last trained model.
Z = kmeans.predict(np.c_[xx.ravel(), yy.ravel()])

# Put the result into a color plot
Z = Z.reshape(xx.shape)
plt.figure(1)
plt.clf()
plt.imshow(Z, interpolation='nearest',
           extent=(xx.min(), xx.max(), yy.min(), yy.max()),
           cmap=plt.cm.Paired,
           aspect='auto', origin='lower')

plt.plot(reduced_data[:, 0], reduced_data[:, 1], 'k.', markersize=2)
# Plot the centroids as a white X
centroids = kmeans.cluster_centers_
plt.scatter(centroids[:, 0], centroids[:, 1],
            marker='x', s=169, linewidths=3,
            color='w', zorder=10)
plt.title('K-means clustering on the digits dataset (PCA-reduced data)\n'
          'Centroids are marked with white cross')
plt.xlim(x_min, x_max)
plt.ylim(y_min, y_max)
plt.xticks(())
plt.yticks(())
plt.show()
Full Code
import numpy as np
import sklearn
from sklearn.preprocessing import scale
from sklearn.datasets import load_digits
from sklearn.cluster import KMeans
from sklearn import metrics

digits = load_digits()
data = scale(digits.data)
y = digits.target

k = 10
samples, features = data.shape


def bench_k_means(estimator, name, data):
    estimator.fit(data)
    print('%-9s\t%i\t%.3f\t%.3f\t%.3f\t%.3f\t%.3f\t%.3f'
          % (name, estimator.inertia_,
             metrics.homogeneity_score(y, estimator.labels_),
             metrics.completeness_score(y, estimator.labels_),
             metrics.v_measure_score(y, estimator.labels_),
             metrics.adjusted_rand_score(y, estimator.labels_),
             metrics.adjusted_mutual_info_score(y,  estimator.labels_),
             metrics.silhouette_score(data, estimator.labels_,
                                      metric='euclidean')))

clf = KMeans(n_clusters=k, init="random", n_init=10)
bench_k_means(clf, "1", data)